How Satellites Are Helping California's Wildfire Recovery Efforts
No one in Northern California would question that the Camp Fire, in addition to killing scores of people, destroying thousands of buildings and burning a huge amount of acreage, has made the region's air hard to breathe.
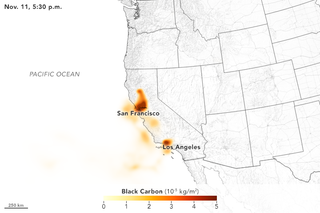
But satellite imagery confirms what Californians are experiencing on the ground — rates of black carbon, an aerosol created by wildfires, have become particularly high in Northern California beginning on Nov. 9. [Satellite Photos of the 2018 California Wildfires]

Black carbon in a type of fine particulate matter, which is known to cause health problems in the respiratory tract and cardiovascular system. Scientists can monitor black carbon by pulling together data gathered by satellites, airplanes and systems on the ground. They also feed in weather data to understand how factors like wind and precipitation affect the aerosol.
Southern California also saw a smaller, more short-lived spike in the pollutant on Nov. 10 and 11 due to the Woolsey Fire that burned west of Los Angeles beginning on Nov. 8. That fire has been almost entirely contained, and the focus is shifting from managing the fire to dealing with its aftermath.

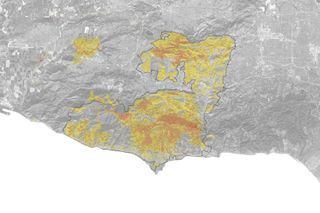
Satellites are assisting with that recovery process as well. NASA runs an online tool that can quickly piece together factors like vegetation and soil type and burn severity to offer a comprehensive picture of a fire, using data from satellites like Landsat, Aqua and Terra.
That picture can then be disseminated to emergency personnel to shape the response to the blaze. For example, the map of the Woolsey Fire shows how the fire devastated steep slopes. That's a concern because without vegetation holding earth in place, these areas are susceptible to landslides.
For the latest updates about these and other California blazes, go to Cal Fire's "Incidents" page.
Get the Space.com Newsletter
Breaking space news, the latest updates on rocket launches, skywatching events and more!
Email Meghan Bartels at mbartels@space.com or follow her @meghanbartels. Follow us @Spacedotcom and Facebook. Original article on Space.com.
Join our Space Forums to keep talking space on the latest missions, night sky and more! And if you have a news tip, correction or comment, let us know at: community@space.com.

Meghan is a senior writer at Space.com and has more than five years' experience as a science journalist based in New York City. She joined Space.com in July 2018, with previous writing published in outlets including Newsweek and Audubon. Meghan earned an MA in science journalism from New York University and a BA in classics from Georgetown University, and in her free time she enjoys reading and visiting museums. Follow her on Twitter at @meghanbartels.
